Satisfactory optimisation
There is a game I sometimes play called Satisfactory. In it, you design a factory with a particular focus on logistics. I’ll leave the arm-chair psychoanalysis to others on why I enjoy such games but it provides a nice testing ground for analysis. One technique I’d like to highlight today is mapping a pareto curve (discussed 8 Feb) with optimisation.
In this game, resource nodes generate raw inputs and the player uses buildings to transform these into more and more complex items. In the end game, the complex items are “sunk” for points. There are limited resource nodes and limited recipes for transforming items so a natural question is, “What is the maximum amount of points can I earn per second and how do I achieve this?” Of course, I don’t have all the time in the world to invest in the game, so instead ask, “What is the maximum amount of points I can achieve given a limited number of buildings?” This is an analogue to maximising revenue given a fixed investment.
I whipped up a linear program to help me, one day I’ll put it up on the web and describe it in detail, but for now assume it can answer the second question. The max points per second is plotted against the number of buildings on the left graph. This is the pareto curve between buildings and production: each point on the line representing a factory configuration. Changing that configuration will either require more buildings or produce less points.
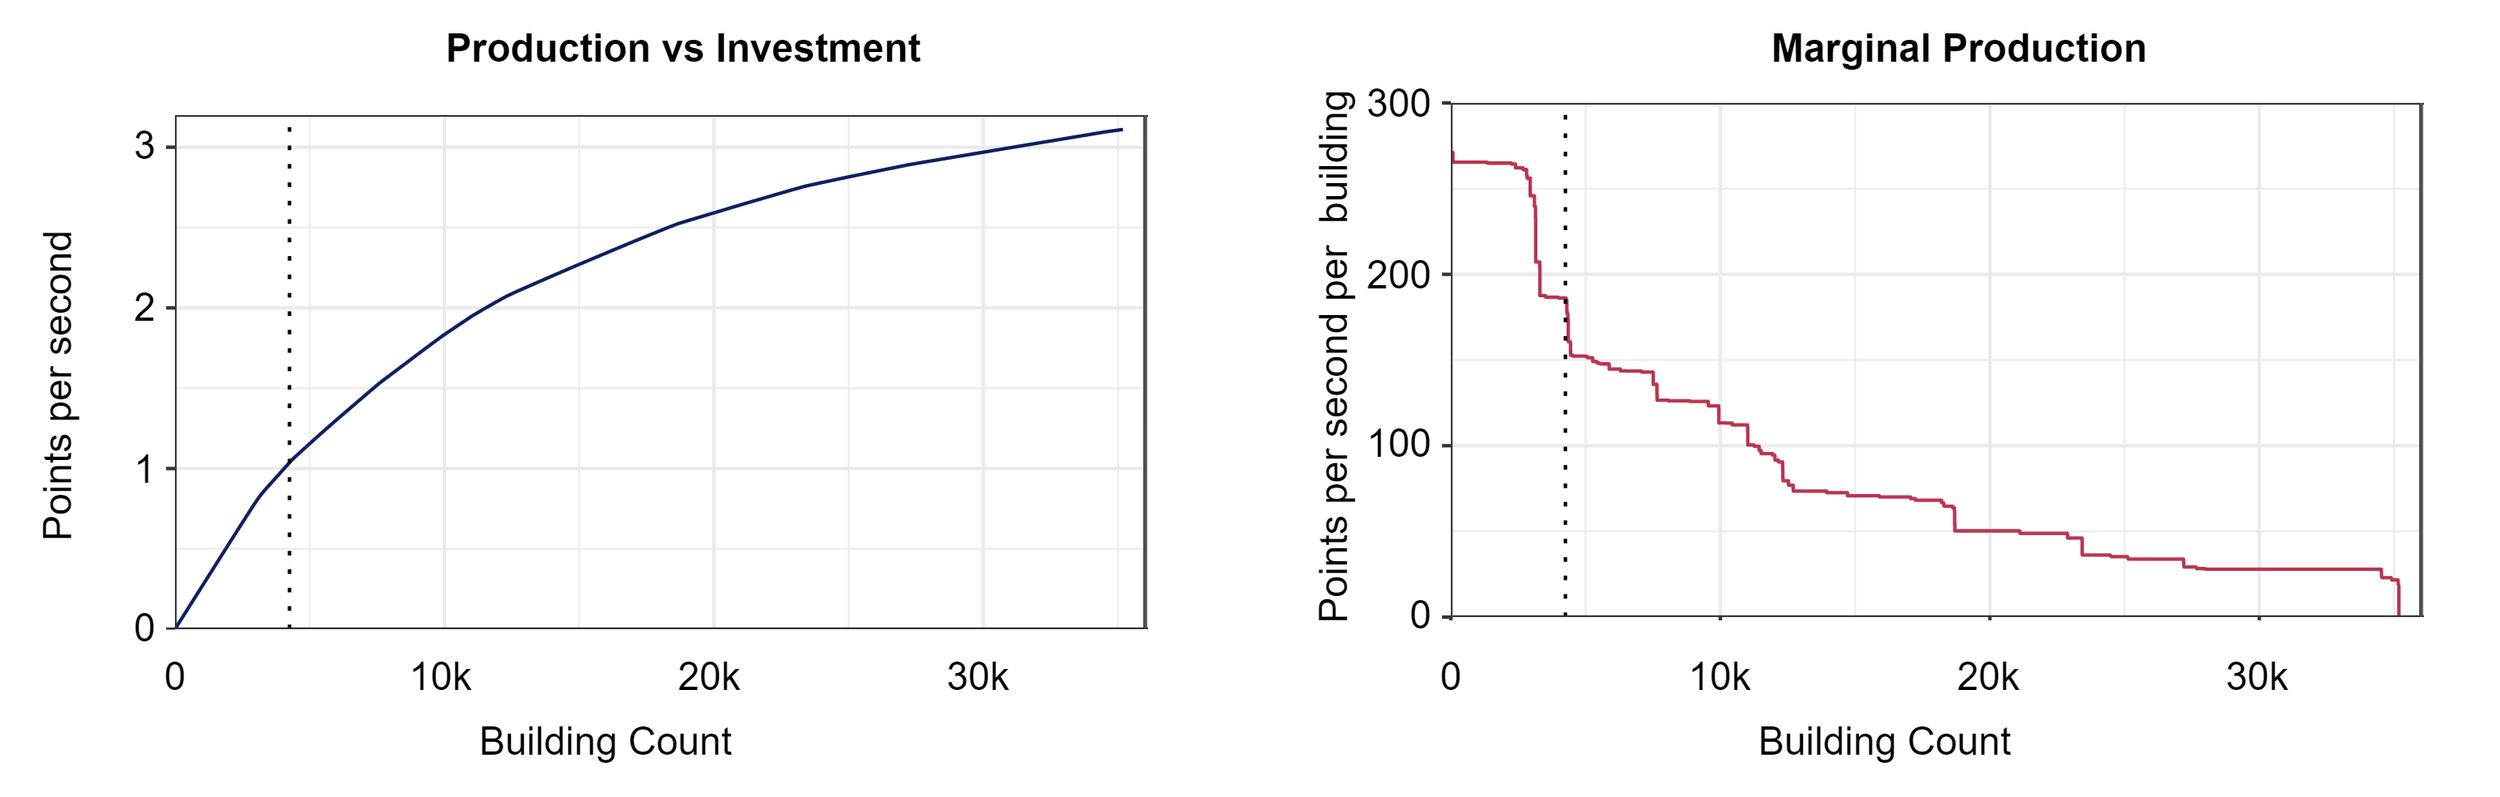
Notice that the curve flattens out as we increase investment. There are diseconomies of scale: for each additional building added, less points are gained for it. As we add buildings and ask for more output we exhaust the resource nodes and need to squeeze more efficiency out of each resource taking more and more buildings to do so. The plot on the right shows this clearly. It’s the marginal production of adding a building: the points per second increase after adding one building. Marginal production is always decreasing, but it is mostly flat with sudden step drops in value. There are different production methods (called recipes) and adding more buildings allows us to transition from a method with few buildings to a more resource efficient method with many buildings. Once a transition is fully complete we need to find a new recipe transition to increase efficiency resulting in a sudden drop in gains.
With this curve we can pick a point which works for our goals. We want a factory that is not too large, but we also don’t want to pick a point which leaves easy wins on the table. The dotted line shows one such point scoring 33% of the maximum using 12% of buildings. If we wanted to expand we would gain 150 points per second per building but shrinking would lose 186. Will I end up building such a factory? Probably not, but the maths was fun enough to work through anyway!
If you’d like an in-depth trade-off analysis of your real operations, email Hello@NorthCardinal.com.au to get in touch.